Most small business owners focus on how their website looks. Very few stop to ask how fast it loads on a phone. That’s where revenue quietly disappears. Sites loading in 1 second convert up to 3 times better than those taking 5 seconds. If your mobile site is slow, you’re not just annoying visitors — you’re handing potential clients to competitors who built faster sites. This guide breaks down why mobile site speed matters, what’s actually hurting your performance, and exactly what you can do about it.
Table of Contents
- What makes mobile site speed uniquely critical for small businesses
- Understanding Core Web Vitals and their impact on mobile speed and SEO
- Mobile vs desktop page speed: challenges and opportunities
- Practical strategies for small businesses to improve mobile site speed
- Why most mobile speed advice misses what really drives conversions
- How we help small businesses succeed with fast mobile websites
- Frequently asked questions
Key Takeaways
| Point | Details |
|---|---|
| Mobile speed drives conversions | Sites loading in under 2 seconds can triple conversion rates compared to slower mobile pages. |
| Core Web Vitals impact SEO | Google uses mobile-focused speed metrics as direct ranking factors since 2021, with greater weight in 2026. |
| Mobile faces unique challenges | Slower networks, less powerful devices, and user impatience make mobile site speed optimization essential. |
| Real-world testing matters | Optimizing with real mobile devices and live networks yields more accurate performance insights than lab tests. |
| Small fixes can boost revenue | Managing images, scripts, and layout shifts can dramatically improve load times and increase sales. |
What makes mobile site speed uniquely critical for small businesses
Your desktop site might feel fast. But pull it up on a mid-range Android phone on a crowded 4G network, and the story changes fast.
Mobile devices account for over 60% of global web traffic, yet networks are slower and processors are far less powerful than what sits inside a laptop. That gap matters enormously. A page that renders in 1.8 seconds on a MacBook can easily take 4 or 5 seconds on a budget smartphone, which is the exact device most of your potential clients are using.

Mobile users also behave differently. They’re often multitasking — waiting in line, riding transit, or searching between meetings. Their patience is shorter. The importance of mobile speed isn’t just technical. It’s psychological. A slow site signals to a visitor that your business isn’t polished, and that first impression sticks.
Here’s what slow mobile loading directly costs you:
- Higher bounce rates. Visitors leave before the page even finishes loading.
- Reduced trust. Slow sites feel outdated or unreliable, especially for coaches and consultants whose brand depends on perception.
- Lower engagement. Users who do stay interact less, click less, and book less.
- Lost ad spend. If you’re running paid traffic to a slow mobile page, you’re paying for visitors who never convert.
Your desktop site being fast does not protect you. Mobile performance needs to be treated as its own priority.
Pro Tip: Open your own website on a real phone using mobile data, not Wi-Fi. Time how long it takes until you can actually read the main headline. That’s closer to what your visitors experience than any lab test result.
Want to understand how site speed directly boosts SEO and conversions across your entire funnel? The connection runs deeper than most people realize.
With mobile’s unique challenges explained, let’s look at the core metrics that actually measure site speed performance.
Understanding Core Web Vitals and their impact on mobile speed and SEO
Google doesn’t guess at quality. It measures it. Core Web Vitals are three specific metrics Google uses to grade your site’s real-world performance, and they directly influence where you appear in search results.
Here’s what each one tracks:
- Largest Contentful Paint (LCP): How long it takes for your main content (usually a hero image or headline) to appear on screen. Google’s threshold for a “good” LCP is under 2.5 seconds.
- Interaction to Next Paint (INP): How quickly your page responds when a user taps a button or link. On mobile processors, JavaScript-heavy pages often fail this one silently.
- Cumulative Layout Shift (CLS): Whether content jumps around while loading. You’ve experienced this — you go to tap a button and it shifts, and you tap the wrong thing instead.
These aren’t vanity metrics. Core Web Vitals are direct Google ranking factors, and the March 2026 update increased their weight at the domain level. That means one slow page can drag down your whole site’s visibility, not just that individual URL.
The performance gap between mobile and desktop is real and measurable:
| Metric | Desktop (good threshold) | Mobile pass rate |
|---|---|---|
| LCP | Under 2.5 seconds | 62% of mobile pages pass vs 74% desktop |
| INP | Under 200 ms | Mobile fails more often due to slower CPUs |
| CLS | Under 0.1 | Often fails on mobile due to late-loading ads |
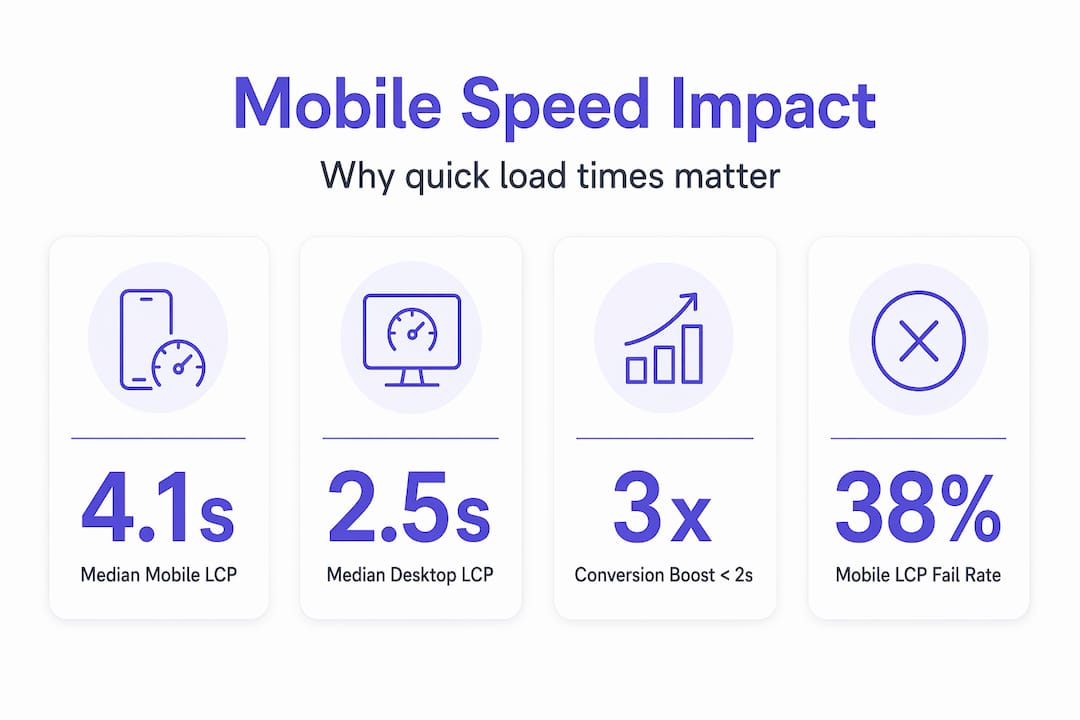
That gap between 62% and 74% might sound small. But if you’re in the 38% of mobile pages failing LCP, your site ranks lower, loads slower, and converts less than competitors who solved the same problem.
Pro Tip: Run your site through Google Search Console’s Core Web Vitals report. It separates mobile from desktop performance and shows exactly which pages need attention first. Fix the highest-traffic pages before anything else.
For a broader look at how mobile speed and conversion rates connect in practice, the data is consistently clear: speed wins.
Now that you understand what metrics matter, let’s look at how mobile and desktop performance actually differ and what that means for your business.
Mobile vs desktop page speed: challenges and opportunities
The performance gap between desktop and mobile isn’t a minor inconvenience. It’s a measurable revenue problem.
Median mobile LCP sits at 4.1 seconds compared to 2.5 seconds on desktop. That 1.6-second gap is responsible for roughly half the conversion difference between the two platforms. If your desktop site converts at 3%, your mobile site might be converting at 1.5% simply because of load time.
What causes mobile to lag so far behind? Mobile networks, limited device CPUs, and heavier JavaScript bundles are the main culprits. Here’s how they break down:
| Factor | Desktop impact | Mobile impact |
|---|---|---|
| JavaScript execution | Minimal on fast CPUs | Major bottleneck on mid-range phones |
| Network latency | Stable broadband | Variable 4G/5G, dead zones |
| Image delivery | Uncompressed often fine | Requires compression and modern formats |
| Third-party scripts | Minor delay | Can add 1-3 seconds on mobile |
The fix isn’t a complete rebuild. In most cases, it’s targeted changes that directly address mobile’s unique constraints:
- Audit your JavaScript load. Find scripts that fire on page load but aren’t needed until a user interacts. Defer them.
- Convert images to WebP format. WebP images are 25-35% smaller than JPEGs with no visible quality loss.
- Evaluate every third-party script. Each analytics tag, chat widget, or retargeting pixel adds load time. Cut anything that doesn’t directly drive revenue.
- Use mobile-specific performance tools. Google’s PageSpeed Insights shows separate mobile and desktop scores. Focus on mobile.
Bridging mobile speed gaps between platforms doesn’t require a technical background. It requires knowing what to look at and acting on it in priority order.
Understanding these challenges leads to practical strategies you can act on right now.
Practical strategies for small businesses to improve mobile site speed
You don’t need to be a developer to move the needle on mobile performance. These strategies work whether you’re running a WordPress site, a Squarespace page, or a custom-built funnel.
The impact of mobile loading time is significant. Shaving seconds off mobile load time can boost conversion rates by up to 92% and increase monthly revenue by over 80%. That’s not a marginal gain. That’s a business-level result from a technical fix.
Here’s how to approach it:
- Start with images. They’re almost always the biggest contributor to slow LCP. Compress every image, use WebP format, and use lazy loading for images below the fold.
- Use a Content Delivery Network (CDN). A CDN stores copies of your site on servers around the world, so visitors load your content from a nearby server, not one in a distant data center. Most hosting providers offer this as an add-on.
- Minify and defer JavaScript and CSS. Minifying removes unnecessary code. Deferring means scripts load after your main content, so users see the page faster.
- Limit third-party scripts. Third-party scripts and uncompressed images are two of the biggest mobile speed killers. Audit yours quarterly and remove anything non-essential.
- Reserve layout space for ads and dynamic content. If a banner ad or form loads late and shifts your content, you’re losing visitors. Define height and width for every element to prevent layout shifts.
- Test on a real mid-range device. Use a $200-$300 Android phone on mobile data, not just Chrome DevTools. Real device testing catches issues that lab tools miss entirely.
A few additional wins worth pursuing:
- Enable browser caching so repeat visitors experience near-instant loads.
- Switch to a faster hosting plan if your current server response time exceeds 600ms.
- Preload your LCP image (your hero photo or main headline graphic) to make it appear faster.
Pro Tip: Google’s PageSpeed Insights gives you a list of specific “Opportunities” and “Diagnostics” for your URL. Fix the top three opportunities first. Those alone usually deliver the biggest speed gains.
Building fast, modern websites that convert starts with these fundamentals, then layers design and messaging on top of a solid performance foundation.
Why most mobile speed advice misses what really drives conversions
Here’s something most speed guides won’t tell you: your Lighthouse score is not your user’s experience.
Lighthouse runs in a controlled lab environment. It simulates performance using fixed conditions. But Google actually measures Core Web Vitals using real user field data aggregated over 28 days at the 75th percentile, on real mobile hardware and real networks. That means your “green” Lighthouse score could be hiding serious problems that actual visitors experience every day.
The second overlooked issue is JavaScript execution on mid-range phones. Most developers test on flagship devices or desktop Chrome. But JavaScript re-renders on mobile cause interaction delays that lead to rage clicks and cart abandonment. A user taps a booking button, nothing happens for 800ms, they tap again, the form opens twice. They leave. You never know it happened. INP is specifically designed to catch this, and it’s the metric most small business sites fail silently.
The third thing routinely ignored is layout shift caused by late-loading ads and embeds. Late-loading ads cause 15% abandonment spikes, yet most site builders never reserve space for those elements. The fix is straightforward: define dimensions before the content loads. Consultants and coaches who add testimonial widgets, social proof badges, and booking embeds to their pages are especially vulnerable to this.
The real insight here is this: you can chase a perfect technical score and still have a mobile experience that frustrates users. The answer is to prioritize field data over lab results, real device testing over simulated environments, and user interaction quality over raw load time numbers alone.
We’ve seen sites with 90+ Lighthouse scores that still struggled to convert because INP was terrible on actual phones. We’ve also seen sites with 65 scores that converted well because the core content loaded fast and the call-to-action was never buried under a layout shift. Speed matters. But measured correctly, it matters even more.
Explore more about modern website performance insights and how field data shapes real business outcomes.
How we help small businesses succeed with fast mobile websites
If you’ve made it this far, you know mobile site speed isn’t just a technical checkbox. It’s a direct driver of leads, bookings, and revenue.
At Cosmic Digital Studios, we build custom websites and conversion-focused funnels with mobile performance built in from the start, not patched on after. Every site we build is tested on real devices, scored against Core Web Vitals, and structured to load your most important content first. We manage image optimization, JavaScript handling, and third-party script audits so your mobile visitors get a fast, clean experience that keeps them engaged and moving toward action. Whether you need a full site rebuild or a focused performance overhaul, we build fast, modern websites that convert for small businesses, coaches, and consultants who are serious about growth.
Frequently asked questions
How fast should my mobile site load to avoid losing visitors?
Sites loading under 2 seconds retain significantly more users, while bounce rates surge past 50% once load time exceeds 3 seconds. Aim for meaningful content to appear within 2 seconds on mobile data.
Does mobile site speed really affect my Google search rankings?
Yes. Core Web Vitals have been ranking factors since mid-2021, and the March 2026 update increased their impact at the domain level, meaning your whole site’s visibility is affected by poor mobile performance.
What are simple ways to improve mobile load speed for my small business website?
Reducing image sizes, deferring scripts, and using CDNs are among the most effective fixes. Limiting third-party tracking scripts and testing on a real mid-range mobile device will also produce immediate gains.
Why do mobile devices often experience slower site speeds than desktops?
Mobile LCP is typically 2 to 3 times slower than desktop due to slower processors, less memory, and the variable nature of cellular networks. Even a well-built site can underperform on mobile without specific optimizations for those constraints.
How long until speed improvements reflect in Google rankings?
Google uses a 28-day rolling window of real user data, so speed improvements surface in Search Console after roughly 4 to 6 weeks as new field data replaces older measurements. Make your changes, then monitor your Core Web Vitals report consistently.