
Conversion rate is defined as the percentage of visitors who complete a desired action out of all visitors who land on a page or enter a funnel. It is the single most direct measure of whether your marketing turns traffic into results. A business sending 10,000 visitors to a landing page but booking only 50 calls has a 0.5% conversion rate. That number tells you more about your marketing health than any vanity metric. Understanding what is conversion rate, how to calculate it, and what moves it is the foundation of every profitable digital strategy.
What is conversion rate, and why does it matter?
Conversion rate is the ratio of completed actions to total visitors, expressed as a percentage. The “action” varies by business model. For an e-commerce store, it is a purchase. For a B2B company, it might be a booked demo. For a coaching business, it is often a contact form submission or a call booking. The metric matters because it connects your traffic investment directly to revenue outcomes.
A high volume of traffic with a low conversion rate means you are paying to attract people who never buy. That is a budget problem, not a traffic problem. Conversion rate gives you a clear signal about whether your messaging, offer, and user experience are aligned with what your visitors actually want. It is the metric that separates businesses that grow from those that just get clicks.

Conversion rate optimization, often called CRO, is the practice of systematically improving that percentage. It covers everything from page copy and design to load speed and trust signals. Cosmicdigitalstudios builds websites and funnels specifically around this principle: clean design, clear messaging, and a path that guides visitors toward action.
How to calculate conversion rate accurately
The standard formula is straightforward: divide the number of conversions by total visitors or sessions, then multiply by 100.
Formula: (Conversions ÷ Total Visitors or Sessions) × 100
Here is how that works in practice:
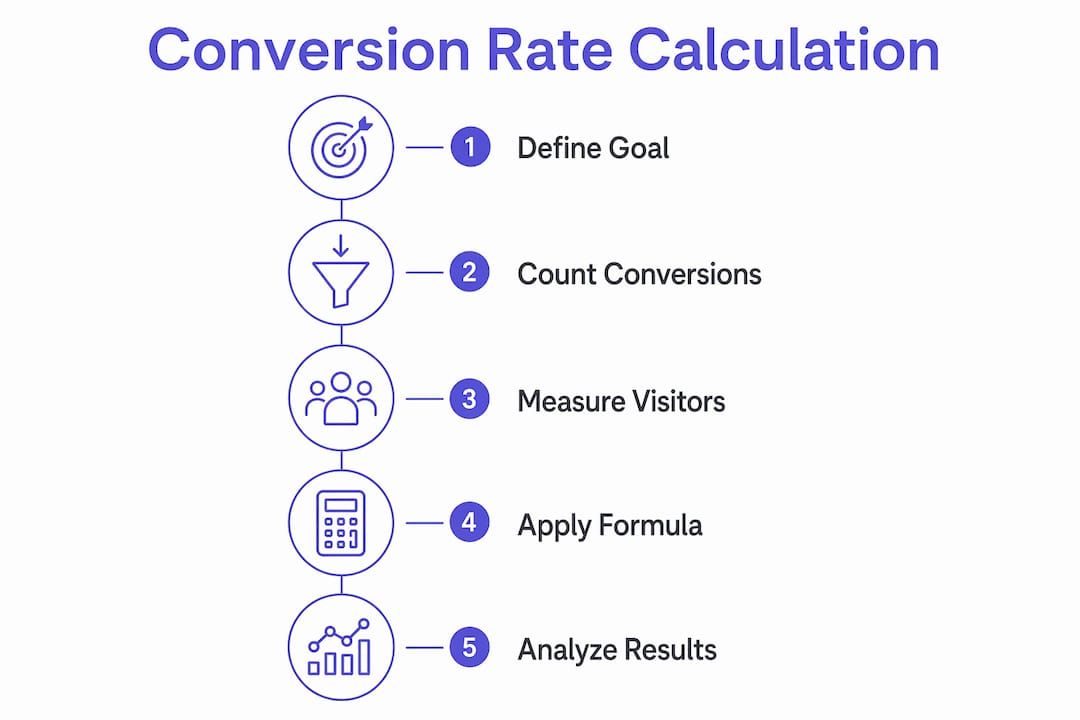
- Identify your conversion event. Decide what counts as a conversion. A purchase, a form fill, a phone call, a download. One event per funnel.
- Pull your visitor count. Use either total sessions or unique visitors. Pick one and stay consistent.
- Apply the formula. If 50 people purchased from 2,000 visitors, your conversion rate is 2.5%.
- Record the denominator you used. Sessions and unique visitors produce different numbers. Document which one you used so future reports stay comparable.
- Repeat on a fixed schedule. Weekly or monthly tracking reveals trends. A single data point tells you nothing.
The denominator choice matters more than most marketers realize. E-commerce platforms typically use sessions because one person may visit multiple times before buying. SaaS companies often prefer unique visitors to measure true audience reach. Mixing sessions and unique visitors across reports produces numbers that cannot be compared. That mistake leads to false conclusions about whether performance is improving.
Pro Tip: Lock your denominator choice in a shared team document before you start tracking. One team using sessions and another using unique visitors will produce reports that look contradictory, even when the underlying performance is identical.
What are typical conversion rate benchmarks across industries?
Benchmarks give you a realistic target. Without them, a 2% conversion rate might feel like failure when it is actually average, or feel like success when your competitors are hitting 8%.
Average e-commerce conversion rates fall between 1.4% and 2.5%, with top-performing stores reaching 3.2% or higher. That gap between average and top performers is not random. It reflects differences in page speed, offer clarity, checkout friction, and trust signals.
| Industry / Context | Typical Conversion Rate Range |
|---|---|
| E-commerce (average) | 1.4%–2.5% |
| E-commerce (top performers) | 3.2%+ |
| Optimized landing pages | 5%–15% |
| B2B sales conversions | ~15% |
| Generic website pages | Below 1% |
Well-optimized landing pages see conversion rates of 5%–15%, and B2B sales conversion rates often reach around 15%. That is a significant jump from a standard website page. The difference is focus. A landing page has one goal, one audience, and one call to action. A general website page tries to serve everyone and often converts no one effectively.
The channel you use also shifts your benchmark. Paid search traffic typically converts higher than social media traffic because search visitors already have purchase intent. Email campaigns to warm lists outperform cold display ads by a wide margin. Comparing your email conversion rate to your paid social rate is like comparing apples to oranges. Segment by channel before drawing any conclusions.
What affects conversion rate, and what are common measurement pitfalls?
Several variables drive conversion rate up or down. The most impactful ones are:
- Traffic quality. Visitors who arrive with high intent convert at higher rates. Broad, untargeted campaigns bring volume but not buyers.
- Landing page experience. Slow load times, unclear headlines, and weak calls to action all reduce conversions. Website speed directly affects how many visitors stay long enough to convert.
- Messaging alignment. When your ad promises one thing and your landing page delivers another, visitors leave. The message must match from first click to final action.
- Device type. Segmenting conversion data by device type reveals gaps that aggregate averages hide. Desktop users may convert at 5.2% while mobile users convert at only 1.1% on the same page.
- Geographic and demographic fit. An offer that resonates in one market may fall flat in another. Geography and audience segment both shift conversion rates meaningfully.
The measurement pitfalls are just as damaging as the performance problems. Defining a primary conversion goal per funnel is critical. Mixing micro-conversions (like newsletter signups) with macro-conversions (like purchases) inflates your reported rate and obscures what is actually driving revenue. Keep secondary actions tracked separately.
Averaging conversion rates across all traffic sources is another common mistake. A 2% blended rate might hide the fact that your paid search traffic converts at 6% while your organic social converts at 0.4%. That difference changes your entire budget allocation decision.
Pro Tip: Build a segmentation habit from day one. Pull conversion rate by device, by traffic source, and by geography every month. The segment with the lowest rate and the highest volume is almost always your biggest growth opportunity.
How to improve conversion rates with practical strategies
Improving your conversion rate requires a structured approach, not random changes. These five strategies produce consistent results:
-
Define your primary conversion event first. Every funnel needs one main goal. Secondary actions like email signups or video views are useful data points, but they should never share the same conversion counter as your primary goal. Clarity here prevents inflated metrics and bad decisions.
-
Balance click-through rate and conversion rate together. A high CTR with a low conversion rate signals over-promising ads or wrong audience targeting. A low CTR with a high conversion rate signals highly qualified leads but weak initial appeal. You need both metrics moving in the right direction simultaneously.
-
Run A/B tests with revenue as the final judge. A/B test winners based on conversion rate alone do not guarantee commercial success. A variation that increases form submissions by 20% but attracts lower-quality leads can actually reduce revenue. Always confirm that a winning variant also improves revenue before rolling it out.
-
Improve your page experience. Copy, design, and speed all contribute. Messaging often matters more than design for conversions. A page with clear, specific copy and a slow load time will still outperform a beautiful page with vague headlines.
-
Audit your funnel by segment. Pull conversion data by device, source, and geography. Identify the segment with the worst rate and the most traffic. Fix that segment first. The return on effort is highest where the gap between current performance and potential is widest.
Understanding the difference between a landing page and a full website also shapes your conversion strategy. Landing pages built for a single offer consistently outperform multi-page websites for direct response goals.
Key Takeaways
Conversion rate is the most direct measure of whether your marketing investment produces real business outcomes, not just traffic.
| Point | Details |
|---|---|
| Conversion rate definition | The percentage of visitors who complete a desired action, calculated as (Conversions ÷ Visitors) × 100. |
| Industry benchmarks | E-commerce averages 1.4%–2.5%; optimized landing pages reach 5%–15%; B2B sales often hit 15%. |
| Denominator consistency | Always use either sessions or unique visitors. Mixing both makes reports incomparable and decisions unreliable. |
| Segment before concluding | Aggregate averages hide performance gaps. Break data down by device, source, and geography first. |
| Revenue over conversion count | A/B test winners must show revenue impact, not just higher conversion numbers, before full rollout. |
Why most marketers measure conversion rate wrong
After working with dozens of businesses on their funnels and websites, the pattern I see most often is not a traffic problem. It is a measurement problem. Teams celebrate a rising conversion rate without asking what is actually being counted. They mix newsletter signups with purchase completions, or they compare this month’s sessions-based rate to last quarter’s unique-visitor rate, and then wonder why the numbers feel inconsistent.
The businesses that get conversion rate right share one habit: they define their primary conversion event before they launch anything. Not after. Not during a review meeting when the numbers look off. Before. That single discipline eliminates most of the confusion I see in marketing reports.
The other thing I push hard on is the A/B testing trap. Marketers declare a winner after two weeks because the conversion rate ticked up by 1.2%. Then they roll it out and revenue stays flat. The variant attracted more signups but lower-quality leads. Revenue is the only scoreboard that matters. Conversion rate is a leading indicator, not the final answer.
Focus on turning visitors into clients with a clear funnel, consistent measurement, and a page experience that earns trust fast. That combination outperforms any single tactic.
— Max
How Cosmicdigitalstudios builds sites that actually convert
If your traffic is solid but your conversion rate is not, the problem is almost always your website or funnel, not your ads.

Cosmicdigitalstudios builds custom websites, landing pages, and conversion-focused funnels designed to guide visitors toward one clear action. Every build starts with your business goal and works backward through messaging, design, and page structure. Whether you need a full website redesign or a focused lead generation funnel, the work is built to produce measurable results. Visit Cosmicdigitalstudios to see how we help businesses turn attention into booked calls, leads, and sales.
FAQ
What is the conversion rate definition in marketing?
Conversion rate is the percentage of visitors who complete a specific desired action, such as a purchase, form submission, or call booking. It is calculated by dividing the number of conversions by total visitors or sessions, then multiplying by 100.
What is a good conversion rate for a website?
Average e-commerce conversion rates fall between 1.4% and 2.5%, while well-optimized landing pages regularly reach 5%–15%. B2B sales funnels often see conversion rates around 15%.
How do sessions and unique visitors differ in conversion rate calculation?
Sessions count every visit, including repeat visits from the same person. Unique visitors count each person once. Mixing both denominators across reports produces incomparable data, so you must pick one and use it consistently.
What is the most common mistake in conversion rate optimization?
The most common mistake is optimizing for conversion volume without confirming revenue impact. A/B test variants that increase conversions can still reduce revenue if they attract lower-quality leads.
What factors affect conversion rate the most?
Traffic quality, landing page load speed, message alignment between ads and pages, and device type all significantly affect conversion rate. Segmenting data by these variables reveals which factor is limiting your results most.